Measures for the Analysis of Location
The analysis for the choice of appropriate area and corresponding site is based on a number of measures described below. The fundamental object of location analysis is to maximize the profits by minimizing the total cost of production process and marketing cost of finished product.
Total Costs = Fixed costs + Operational costs
Fixed Costs include expenditure on land, building, machines and other equipments etc.
Operational costs are the expenditure incurred on inputs, transformation process and the distribution of output.
The contribution of various factors to the total costs will vary from plant to place e.g. a possible advantage of cheap labour at some place may be offset by more expenditure on fuel, power, taxes etc. Similarly the contribution of various factors also depend on the nature of the product e.g. in oil and chemical product the labour costs represents only a small proportion of total costs whereas it is quite high in garment and textile industries.
Thus the selection of an area and finally the site for a plant needs a careful study if a good job is to be done.
The analysis can be divided into two categories:
1. Involving quantitative factors
i. Comparative cost analysis
ii. Break-even chart
iii. Linear Programming
iv. The Gravity method
2. Comparison of qualitative factors
i. Comparative chart
ii. Ranking and Weight method
1. Quantitative Factor Analysis
The quantitative factor analysis covers those methods which are based on mathematical tools and models and have certain objective criteria. These methods are explained below:
i. Comparative cost analysis/Least cost center analysis
This simple type of analysis is appropriate where the location problem concerns the placement of a single plant. There can be two approaches under this method:
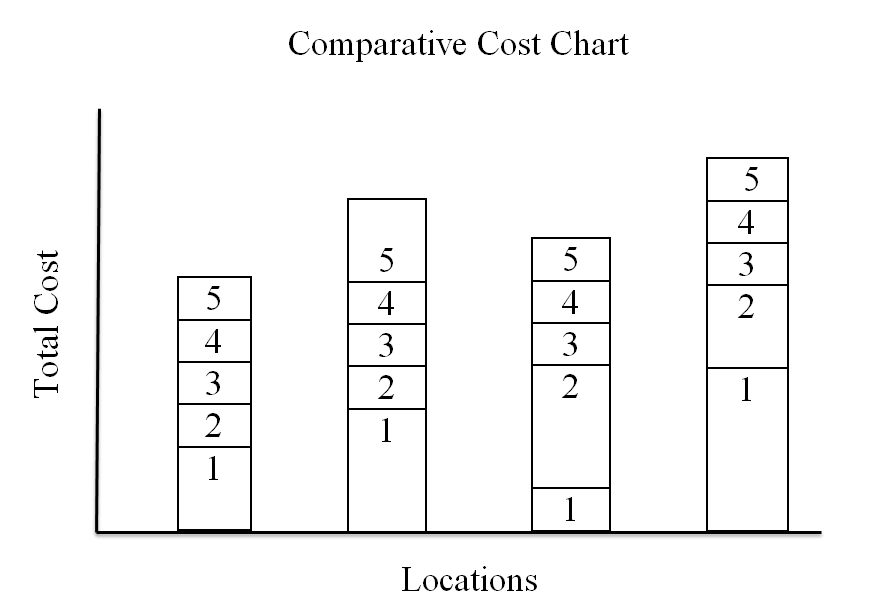
a) Comparative Cost Chart
This is based on location cost summary chart. A comparative chart of total costs involved in setting up a plant of desired size is prepared. Consider four locations A, B, C and D and five factors 1, 2, 3, 4 and 5 on which the choice of location depends. These can be expenditures on land, building and other moving expenses. In the following figure the relevant operative cost factors are taken on vertical axis and the locations on horizontal axis. Some units of output is chosen and the cost per unit of out-associated with various factors at each location is listed. The total cost for each location is then added and is represented by the height of the column for each location. We select a location for which the total cost is minimum.
The cost summary chart has the advantage of clarity in presentation and comprehensibility. However the analysis is restricted to certain specified factors only.
b) Least Cost Centre Analysis
Here we consider the transport costs associated with various location alternatives. The analysis can become a basis for further detailed analysis and modifications. The limitations of these techniques are:
- The choice of plant location is assumed to be entirely dependent upon the minimization of the operational costs.
- The operational costs are assumed to be linearly related to the distances involved.
The following example illustrates the procedure for determining transport cost at a particular location.
ii. Break-even chart
The concept of break-even analysis can be used to contrast the objective cost factors of individual locations i.e. contrast between operating costs and the value of capital required at different levels of output is made. The break-even chart can be drawn in two ways.
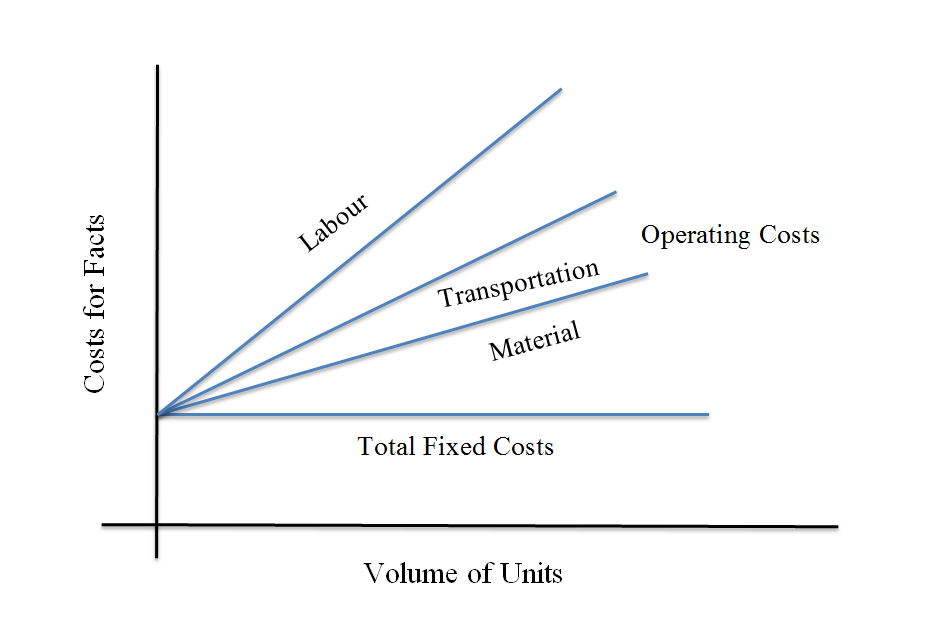
a) Chart to evaluate the relative importance of various cost factors to determine which location would be most advantageous as shown in the following figure. The slope of the variable cost line reflects the behavior of costs that vary with the level of output. Operational factors can also be power, taxes, water, insurance etc.
b) Another break-even chart can be drawn for different locations showing the relationship between total costs at different levels of output.
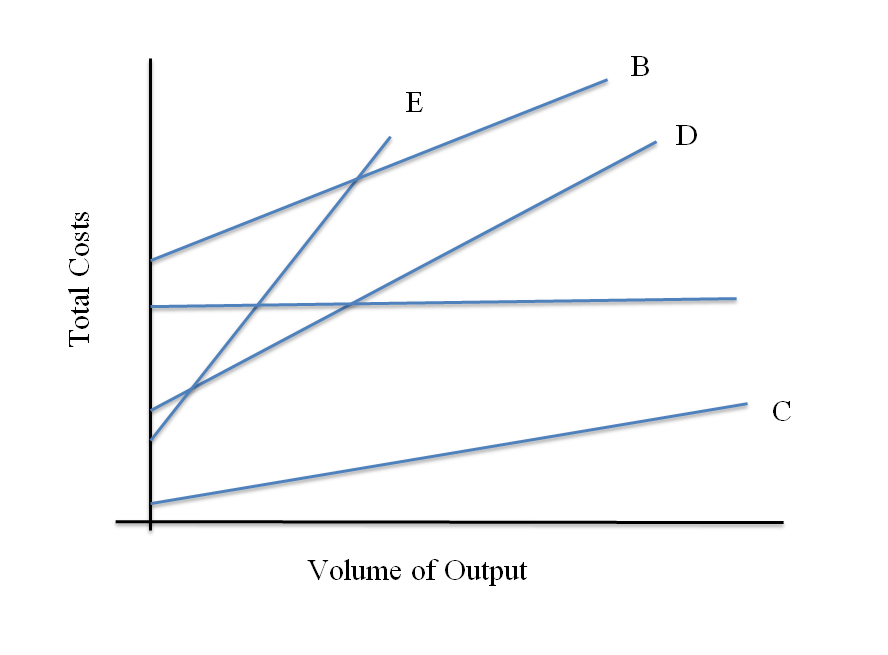
If total cost lines for various locations intersect then it indicates that the advantage of each location is not absolute but will vary according to the level of output.
iii. Linear Programming
It is used for evaluating the cost of prospective locations within a production/distribution network. It can be done by using a matrix of production facilities and warehouses that exhibits the unit shipping costs from a manufacturing location denoted by a variable, say X, to prospective destinations, such as warehouses denoted by other variables A, B and C and total amount of goods the prospective manufacturer, X, could produce. The matrix also includes other prospective manufacturing locations and the same information for each. After computing the total costs for each prospective location, an organization can decide which one has comparatively lower total costs in terms of complete production and distribution network.
iv. The Gravity Method
This model talks about establishing a Centre of Gravity with respect to existing facility available. The centre of gravity method can be used for determining an individual location by considering existing locations, the distances between them, and the volume of products to be shipped. It is generally used for locating distribution warehouse.
2. Comparison of qualitative factors
The qualitative factor analysis is based on opinion, judgment and experience. These methods do not have much mathematical calculations and the opinion of vastly experienced executives matters the most. Qualitative factors related with location analysis are also known as initial factors. These are the factors to which cost value cannot be assigned e.g. lack of good schools, union activity, community attitude etc. These factors can be termed as adequate or inadequate, significant or insignificant, good, excellent etc. for respective locations. The overall contribution of intangible factors for the choice of a particular location can be evaluated by :
i. Comparative chart
Let us consider two locations A and B and compare them on the basis of following factors:
|
Factors |
A | B |
|
Labour |
Adequate | Excellent |
| Recreation | Good |
Very good |
| Union activity | Significant |
Not significant |
| Education | Good |
Very good |
Evidently in this case location B appears to be better than location.
ii. Ranking and Weight method
Here the various locations are ranked according to the contribution of the corresponding factors. Various factors are assigned weights according to their importance in location analysis. The weights of each factor are multiplied with the corresponding rank of a location and the total of these products over all the factors for each location is calculated. The location having maximum total is considered to be most suitable. The following are the steps in the method:
Step (i). Examine the various factors and assign to these weights representing the significance of the factor to the situation being studied. It is convenient to isolate the least significant factor and give it a weight one. All other factors are then expressed as a multiple of this factor and appropriate weights are assigned. Evidently extreme accuracy cannot be expected in assignment of weights.
Step (ii). Each location is examined and ranked for each factor.
Step (iii). Each ranking is then multiplied by the corresponding weight and the scores so obtained are totaled over factors for each location. The location having maximum total is considered to be most suitable.
It is observed that a location selected on the basis of quantitative factors may not tally with the choice based on comparison of qualitative factors. In case both the choices agree then the final selection is made otherwise the management may make a subjective choice. Generally cost criterion is given preference.